3/02/2025 - 16/02/2025 (Week1 - Week2)
Teu Yu Tian / 0371923
Information
Design | Bachelors of Design (Honour) in Creative Media | Taylor's
University
Exercise - Type Exploration & Application
1. LECTURES:
Week 1:
A briefing about the module, exercise and project was given by lecturer.
Student need to prepare some items for the next class for exercise 1.
Exercise 1: quantify raw data and visualize information as a photograph.
Gather them, separate into category such as colour/shape/pattern.
Example of items:
1. box of Lego
2. Jar of button
3. Jar of marble ball
4. Set of colourful rubber strap
Sort it and make it into presentable layout as chart, include the process in
E-portfolio as submission.
Project 2 is group project, 7-10 student
Demo and tutorial will be using after effects. However, student are allowed to
use Canva. Those things are rely on static poster, informative, pretty,
creative animation but not too advanced.
2. INSTRUCTIONS:
Exercise 1:
The object I selected is nano Lego block with different colours, quantity
and shape.
At first, I was quite blur and didn’t know how to start. There were a few
characteristics I could sort them by: size, shape, and colour. So, I just
began with the simplest way—sorting them by colour.
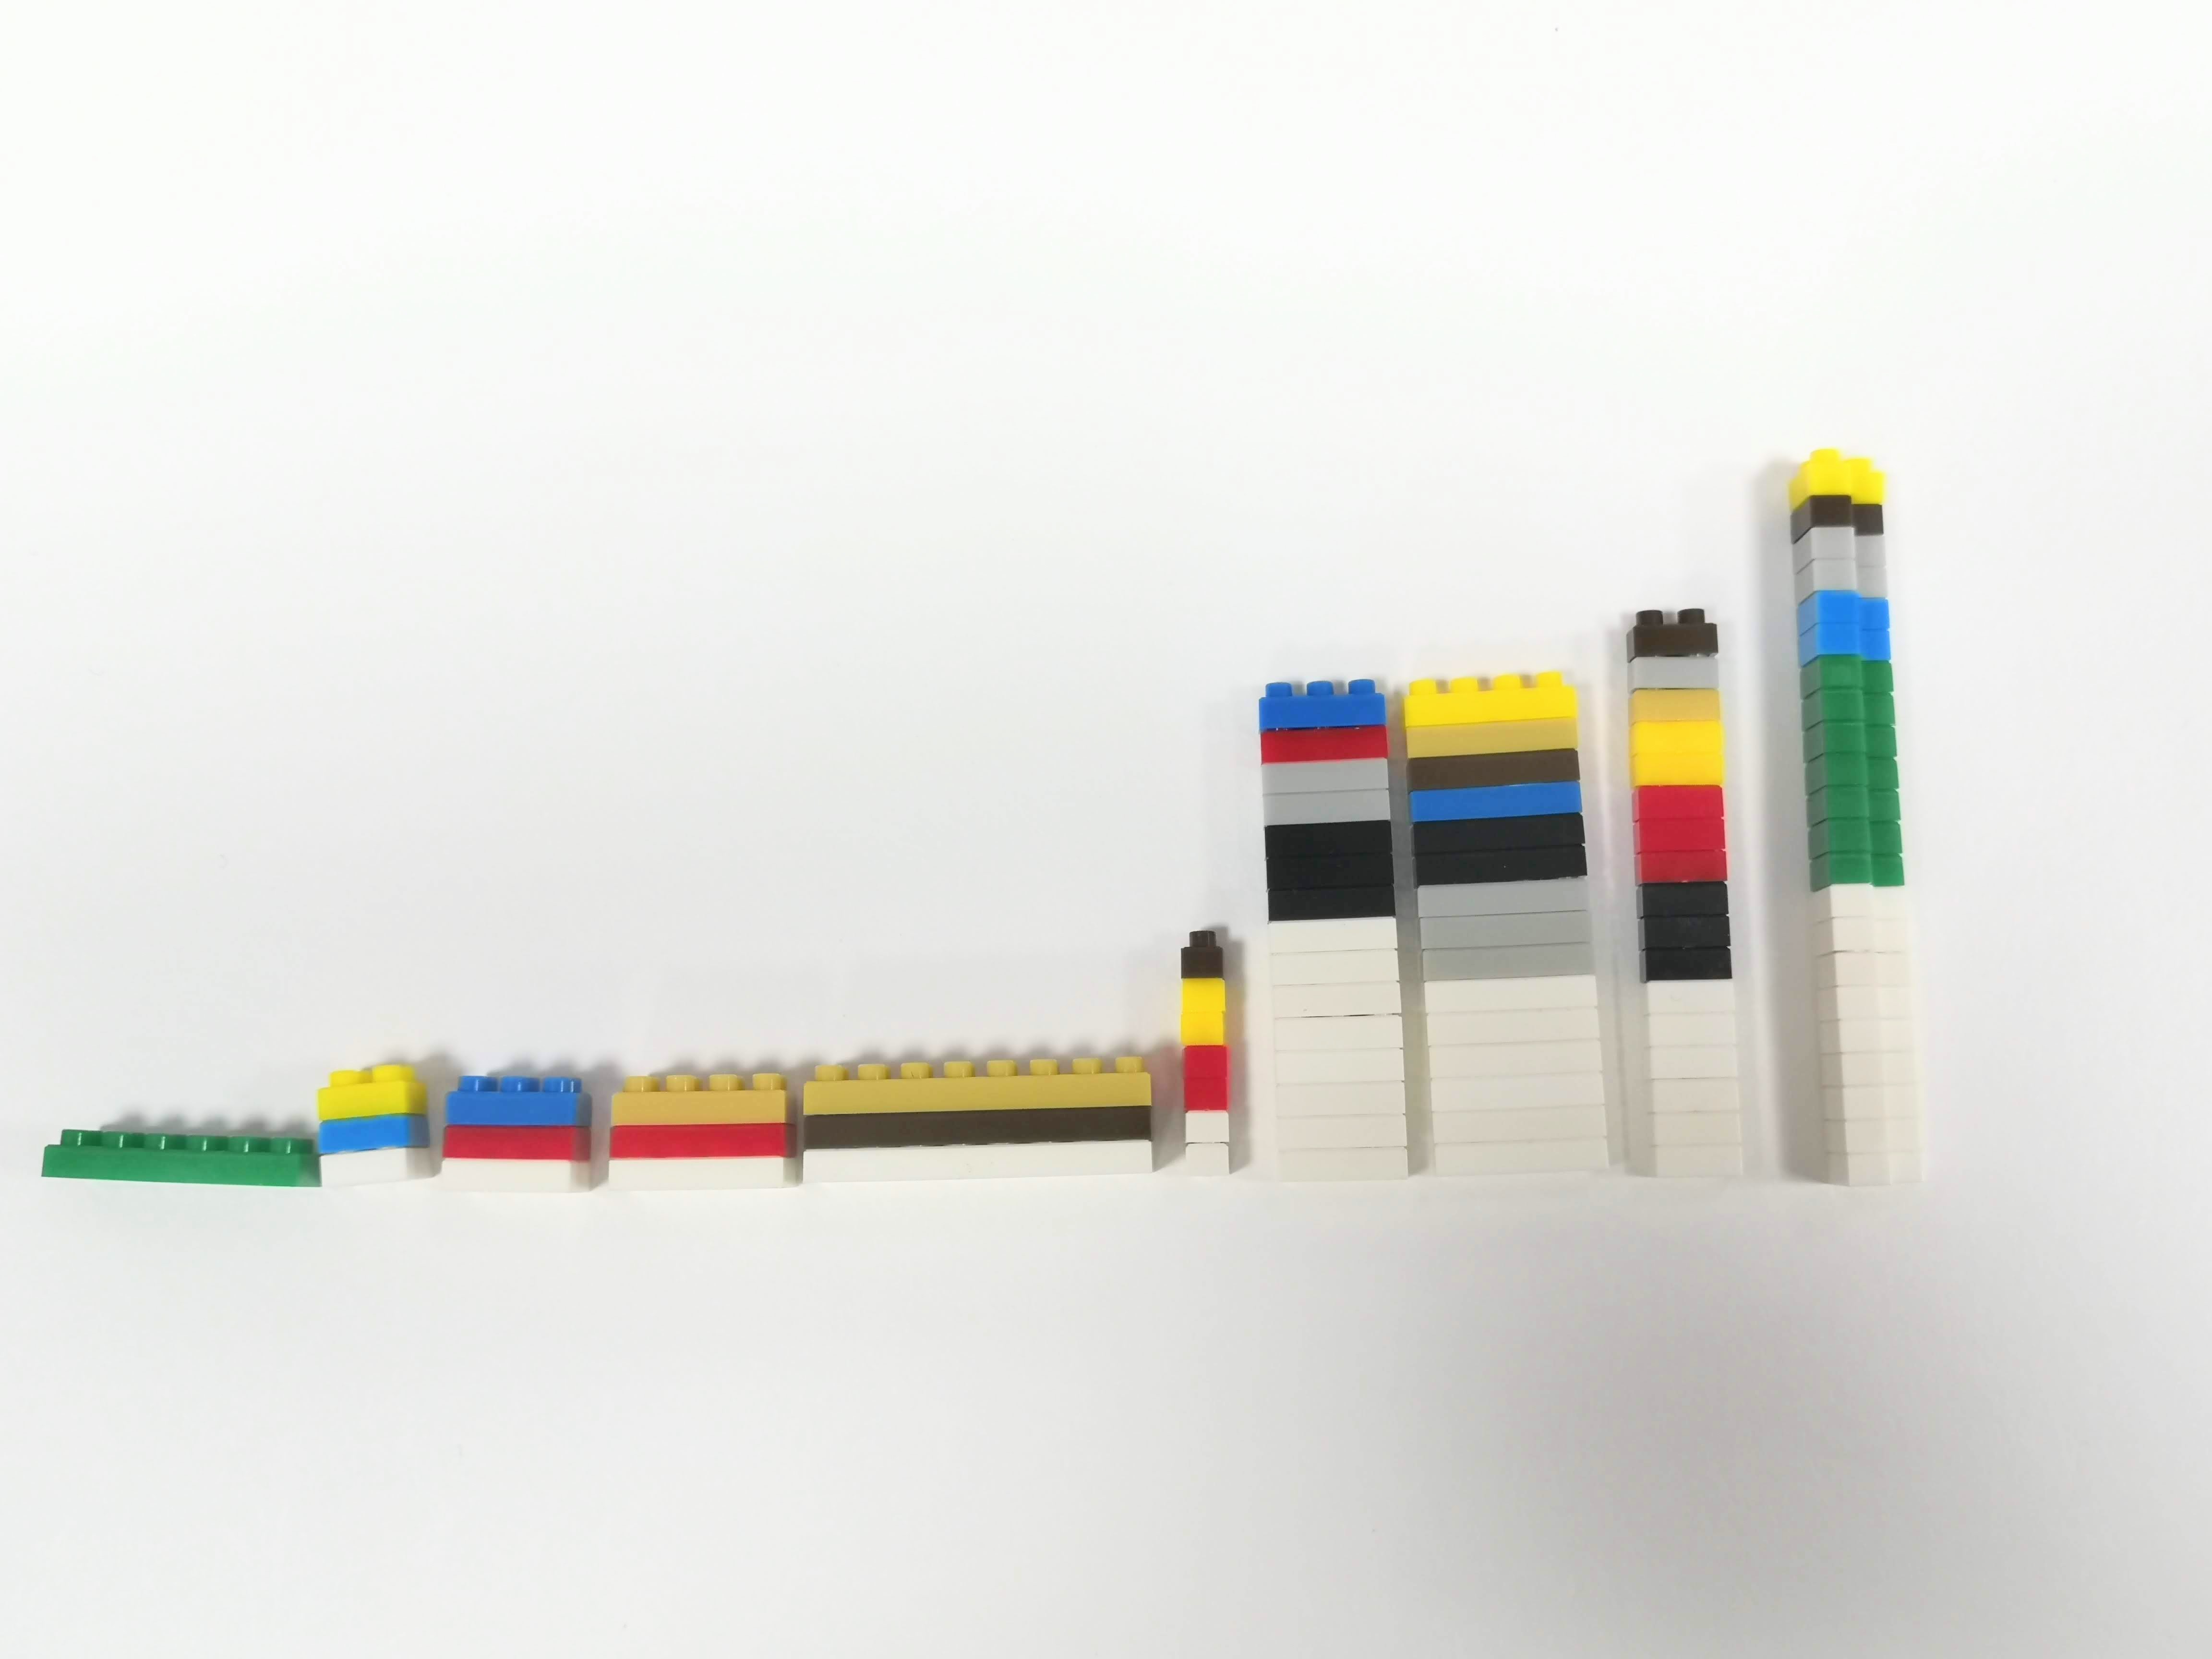
Then, I noticed that they have different shapes. Some are single-row blocks,
while others are double-row. I decided to divide them further and arranged
them by size. The double-row blocks were sorted from most to least columns
(2x8 to L-shape), and the single-row blocks were arranged from 1x4 to 1x1
vertically.
To make the data look less scattered, I tried another version by
arranging them in a table format. Blocks with the same colour and quantity
were placed in the same row horizontally. But I felt there was still room for
improvement.
Next, I stacked the same size blocks together and arranged them from least to
most in number. Now, it looks much neater and easier to understand.
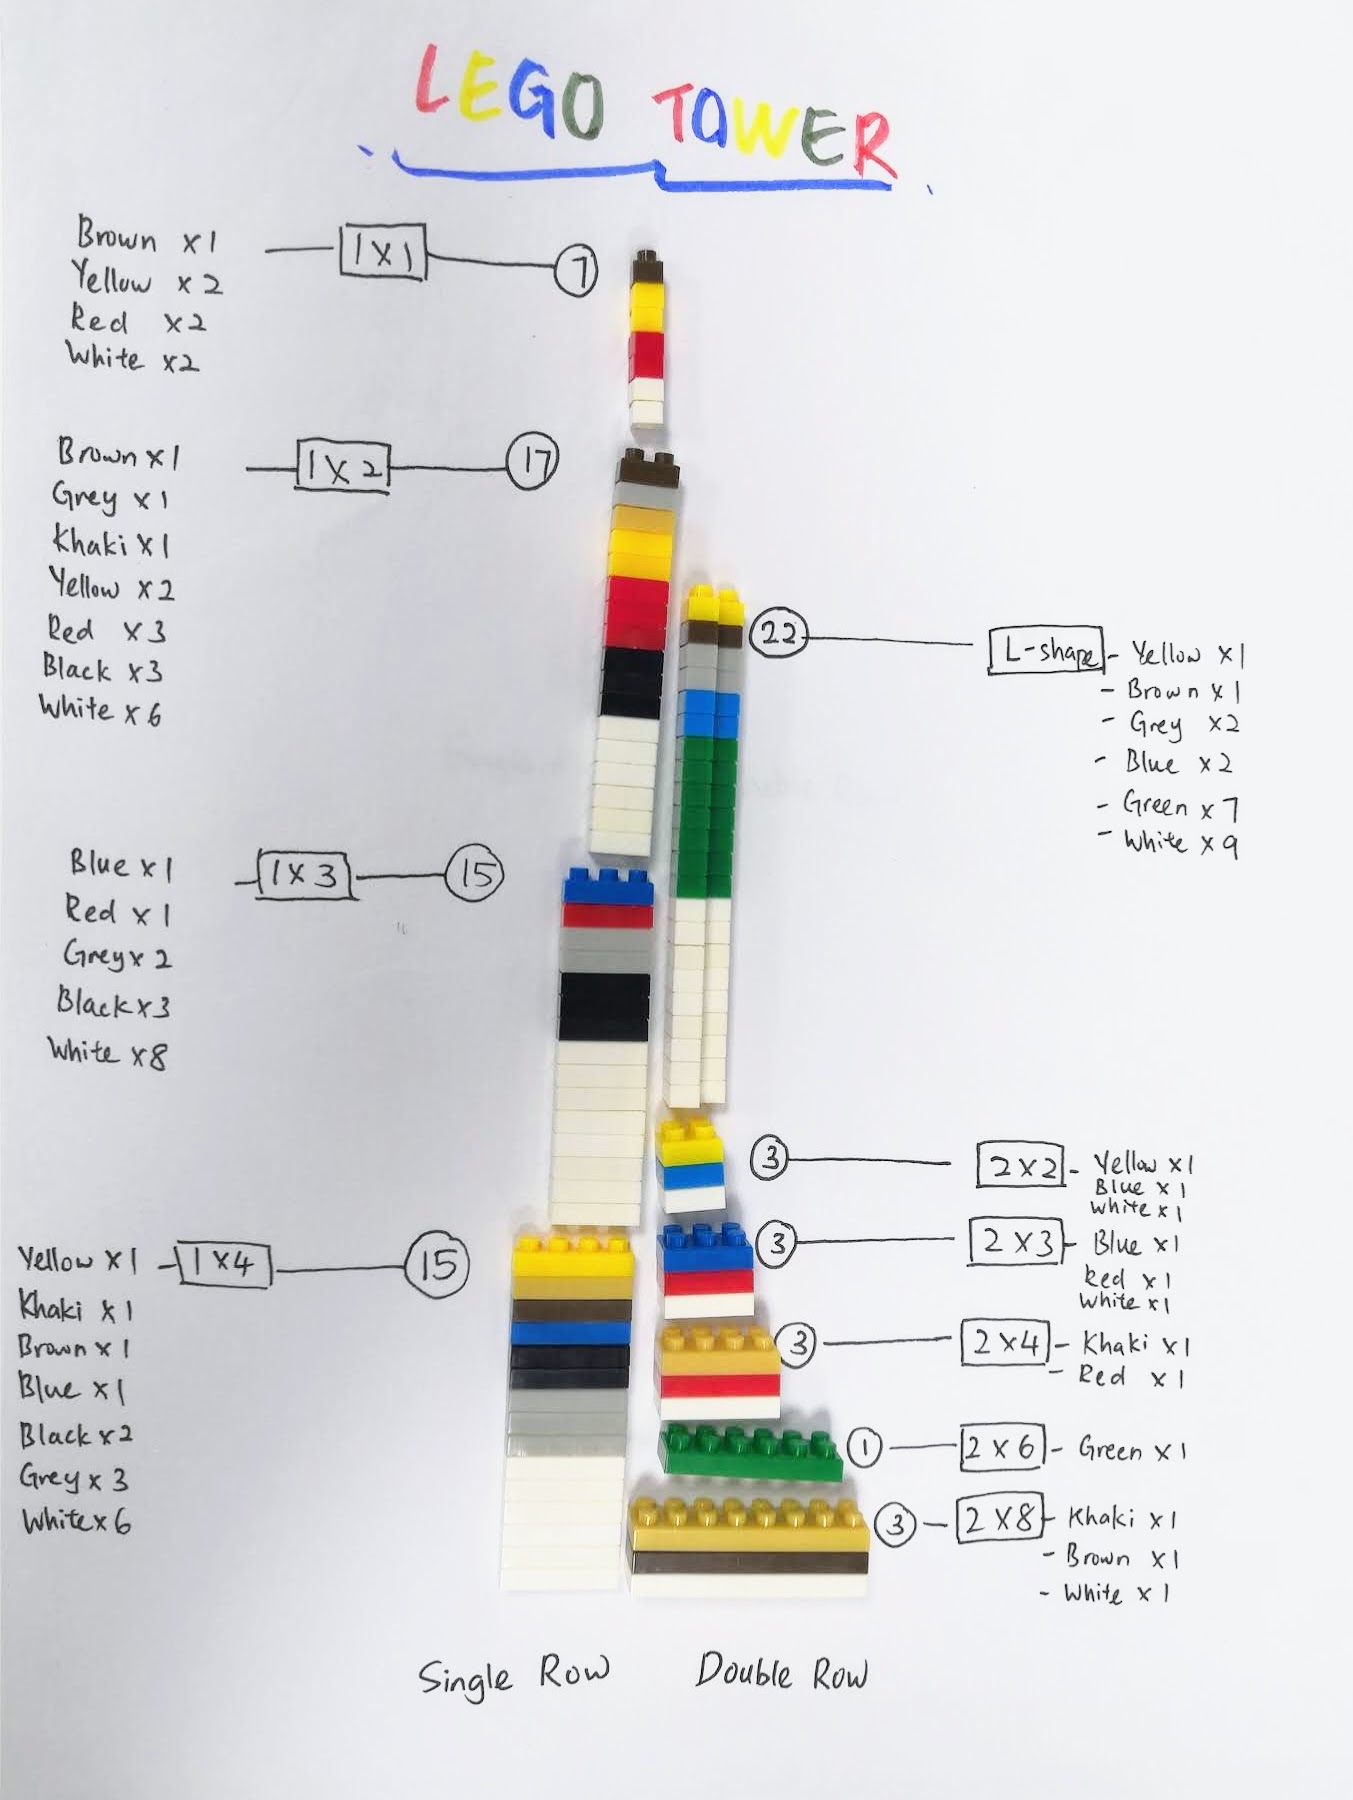
I continued to explore different arrangements and tried making a tower shape.
In the final version, the Lego blocks were divided into two
categories—single-row blocks on the left and double-row blocks on the right.
All colours and quantities were listed beside them. The arrangement was based
on size, from top to bottom, with the smallest pieces at the top and the
biggest at the bottom.
Exercise 2: EXERCISE 2: L.A.T.C.H INFOGRAPHIC POSTER
Instruction:
Organize a group of information into a visual poster that combines and
utilizes the LATCH principles (Minimum 4).
2. You are required to use the digital photo editing/illustration software
available to assemble the information into a LATCH infographic
poster.
3. You are allowed to reuse back the images but you have to create the
rest of visuals to complete the poster.
I decided to go with Citrus Family and done some research based on
that.
Progression:
L: Location of Origin
A: Alphabetical Order
C: Category
H: Vitamin C Content of different Citrus
I dedided to draw the visual again to make it looks more refine.
Arrange according to alphabets
Final Poster:


评论
发表评论